Gauges
The Dashboard Designer is a powerful tool that enables users to create custom and highly interactive reports. By generating various chart types, such as level gauges, users can explore their data from multiple angles and discover the diverse styles it presents. This flexibility makes it an ideal solution for analyzing trends, monitoring performance, and making data-driven decisions more effectively. Level gauges, in particular, are excellent for visualizing key metrics at a glance, such as completion percentages or inventory levels.
How to Create a Gauges Dashboard:
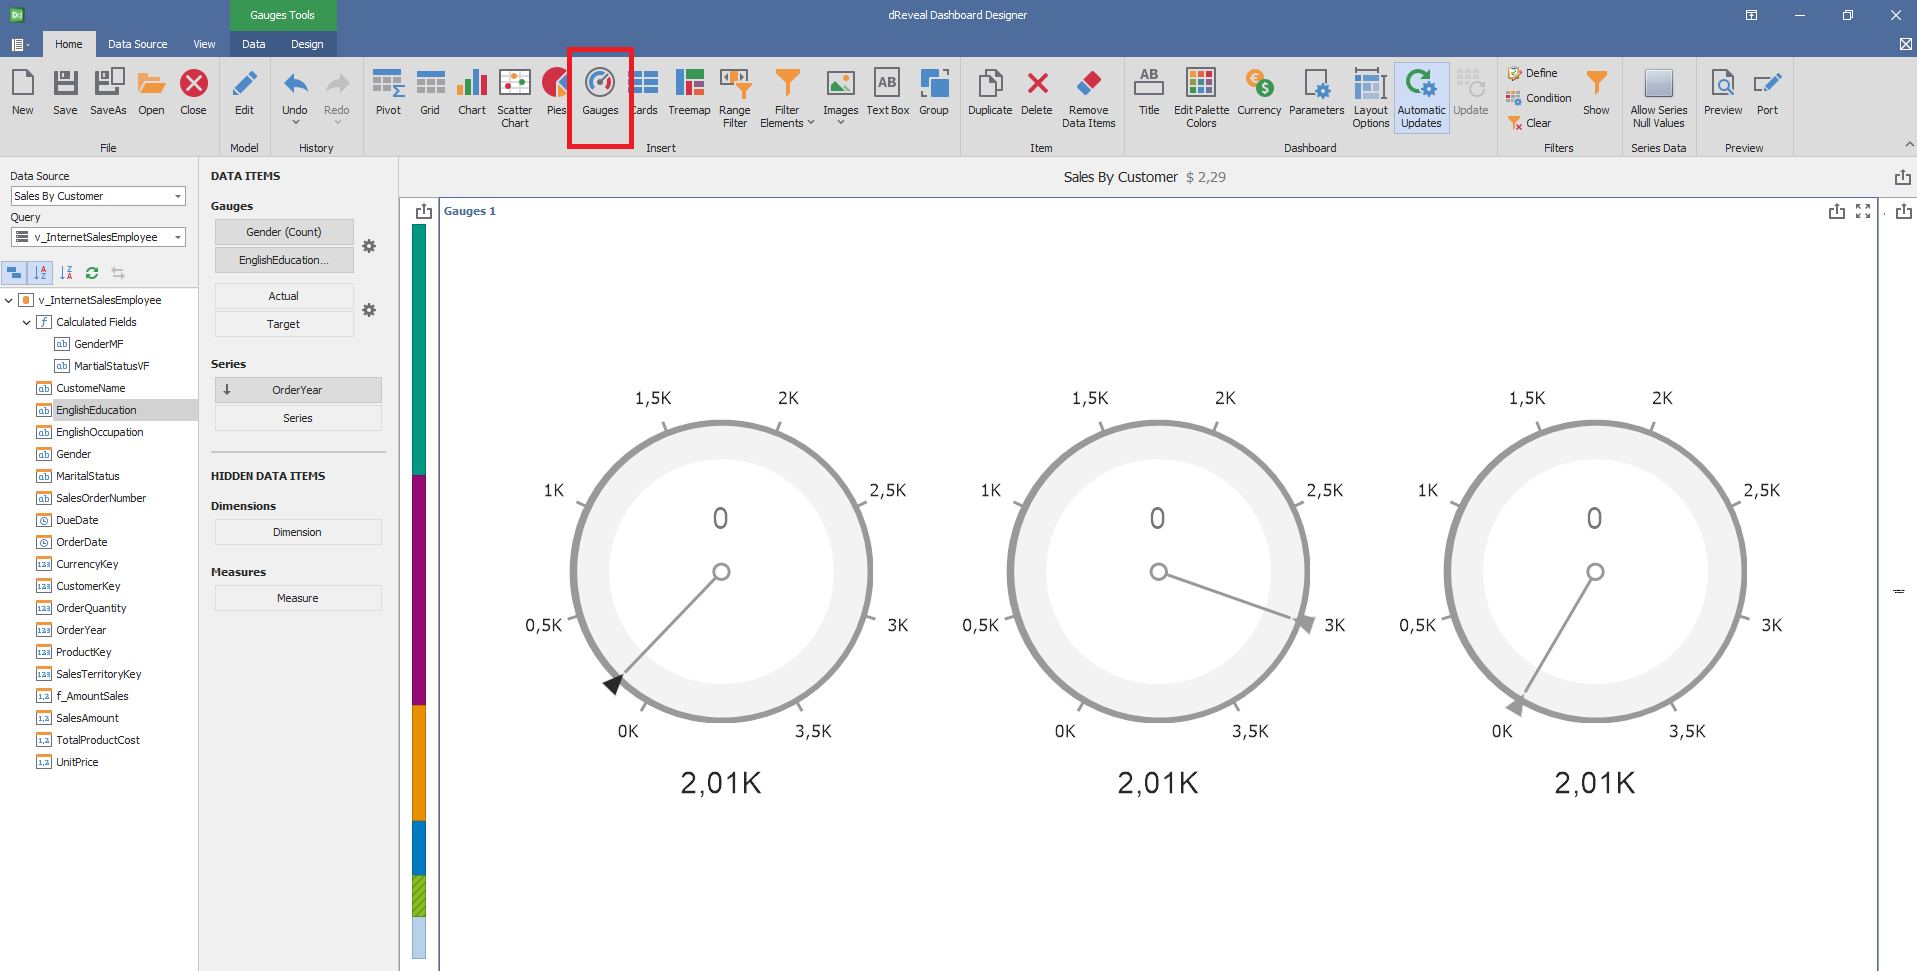
To add a gauge to your report in the Dashboard Designer, simply access the tool, select the desired report, and click the 'Gauges' icon. Then, drag and drop the corresponding columns to the 'Data Items' > 'Columns' section to define the gauge's dimensions and measures.

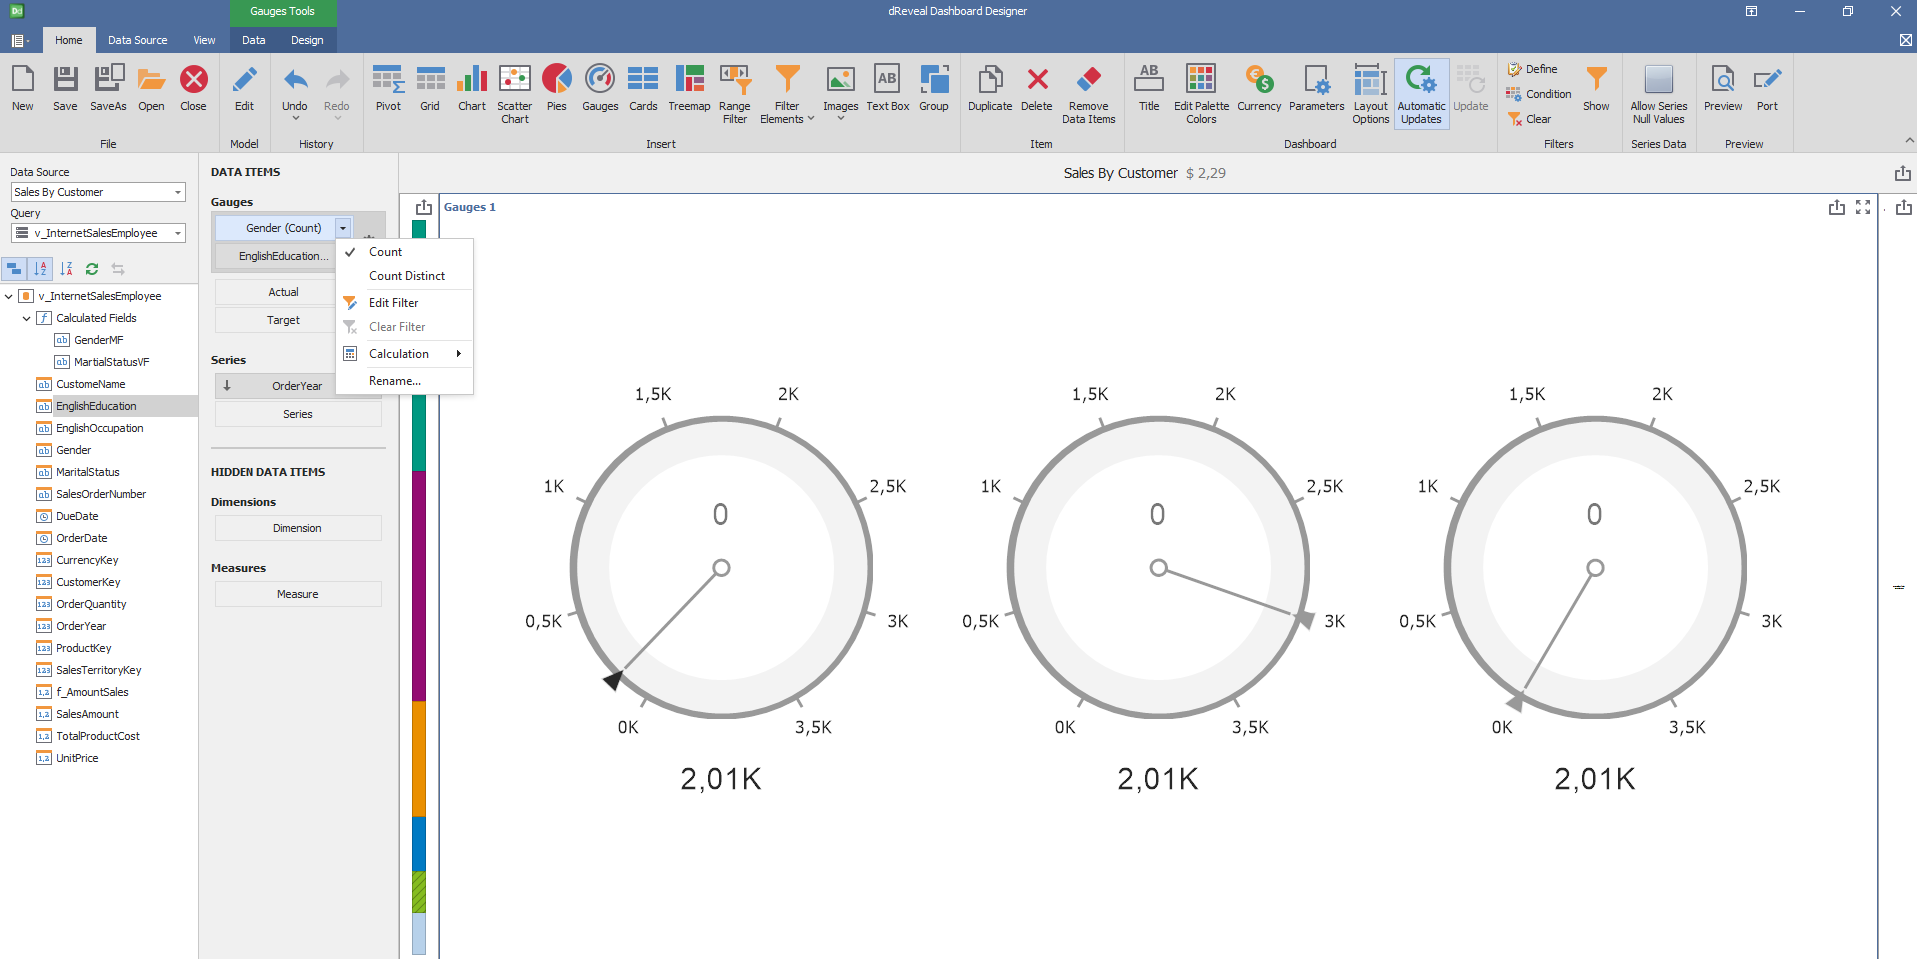
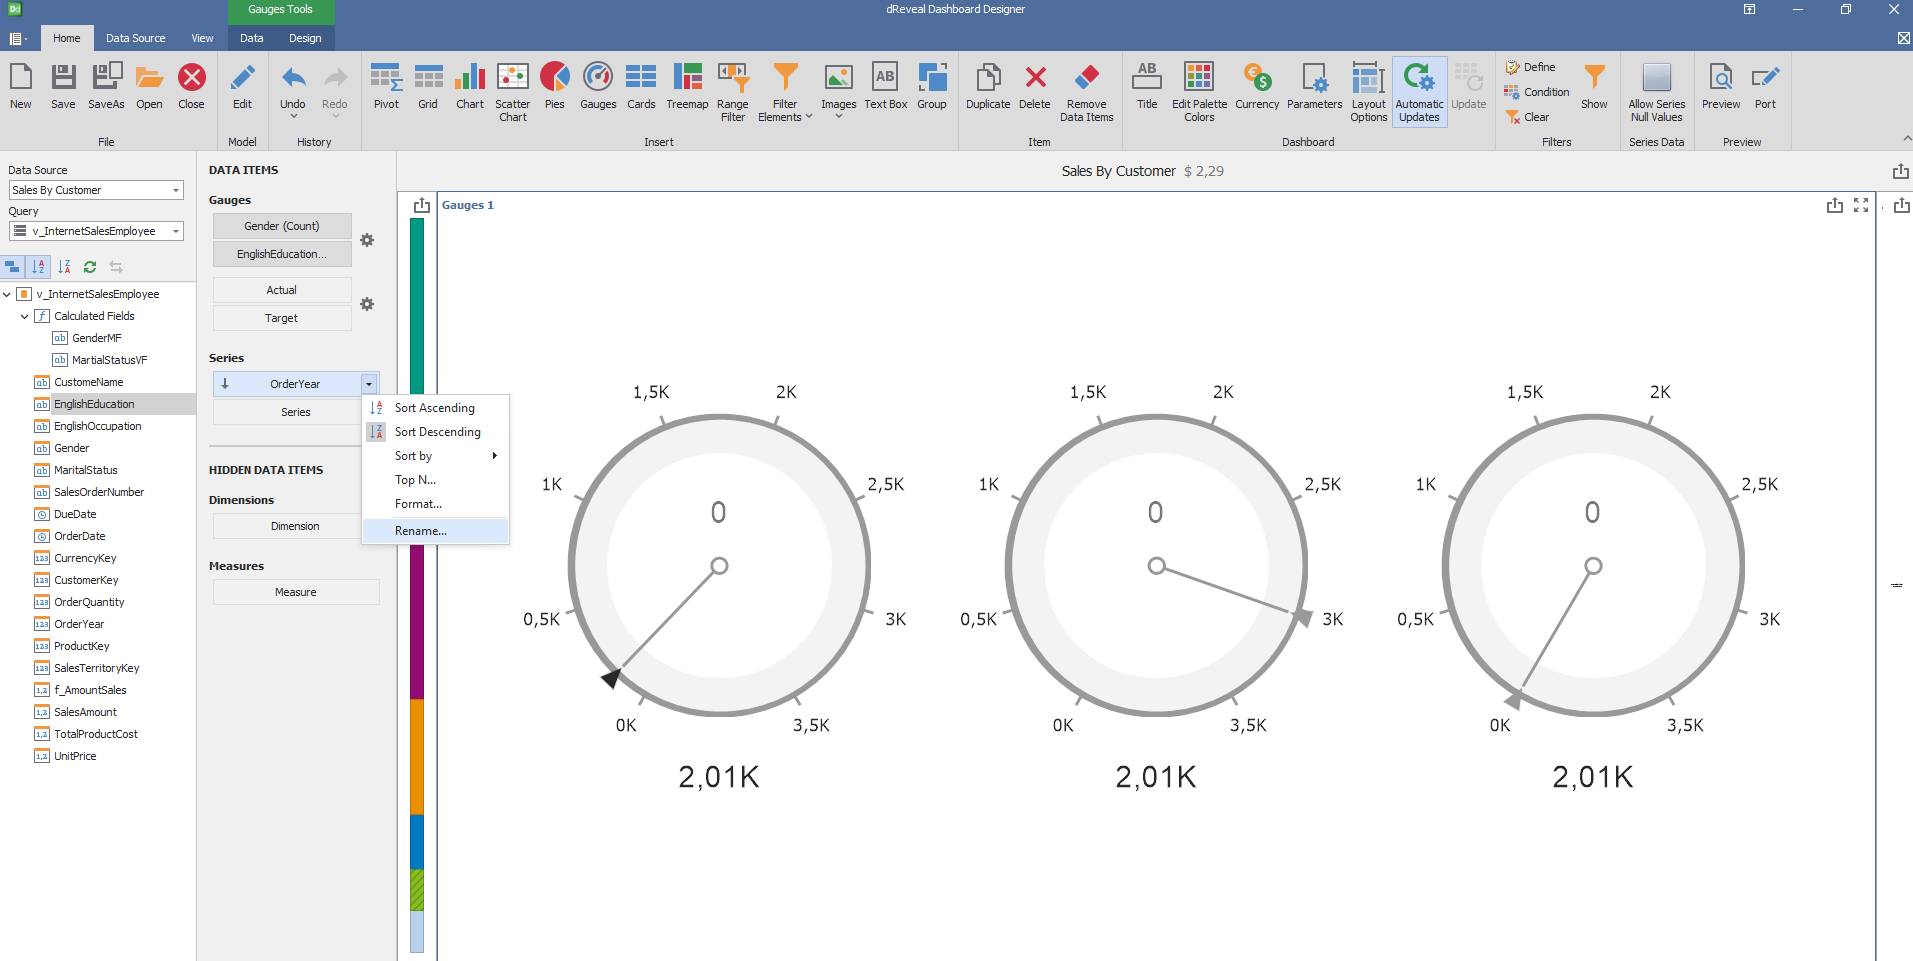
Dashboard Designer also provides various options to customize the 'Gauges' based on the data type displayed in each column. Below is a general overview of the different options you can apply to your Gauges Chart.
Column of type String

Column of type Date:

Design
Dashboard Design also provides various options to customize the 'Gauges Graph' based on the data type displayed in each column. Below is a general overview of the different options you can apply to your Gauges Graph.
Content Arrangement
| Options | Description |
|---|---|
| Auto Arrange | The number of columns and rows is defined automatically. |
| Arrange in Columns | Arrange the elements in the specified number of columns. |
| Arrange in Rows | Arrange the elements in the specified number of rows. |

Style
| Options | Description |
|---|---|
| Full Circular | Display full-circular Gauges. |
| Half-Circular | Display half-circular Gauges. |
| Left-Quarter Circular | Display left quarter circular Gauges. |
| Right-Quarter Circular | Display right quarter circular Gauges. |
| Three-QuarterCircular | Display three-quarter circular Gauges. |
| Linear Horizontal | Display horizontal linear gauges. |
| Linear Vertical | Display vertical linear gauges. |

Labels
| Options | Description |
|---|---|
| Show Gauge Captions | Specify wich values should be displayed within data labels |

